Create usage metrics
Contents
Customer Analytics is in beta
Customer Analytics is currently in beta and free to use. We're actively developing this feature and would love your feedback.
You can create usage metrics in two ways:
- Go to Settings > Customer Analytics and click Add usage metric
- Open any customer profile and click Add usage metric
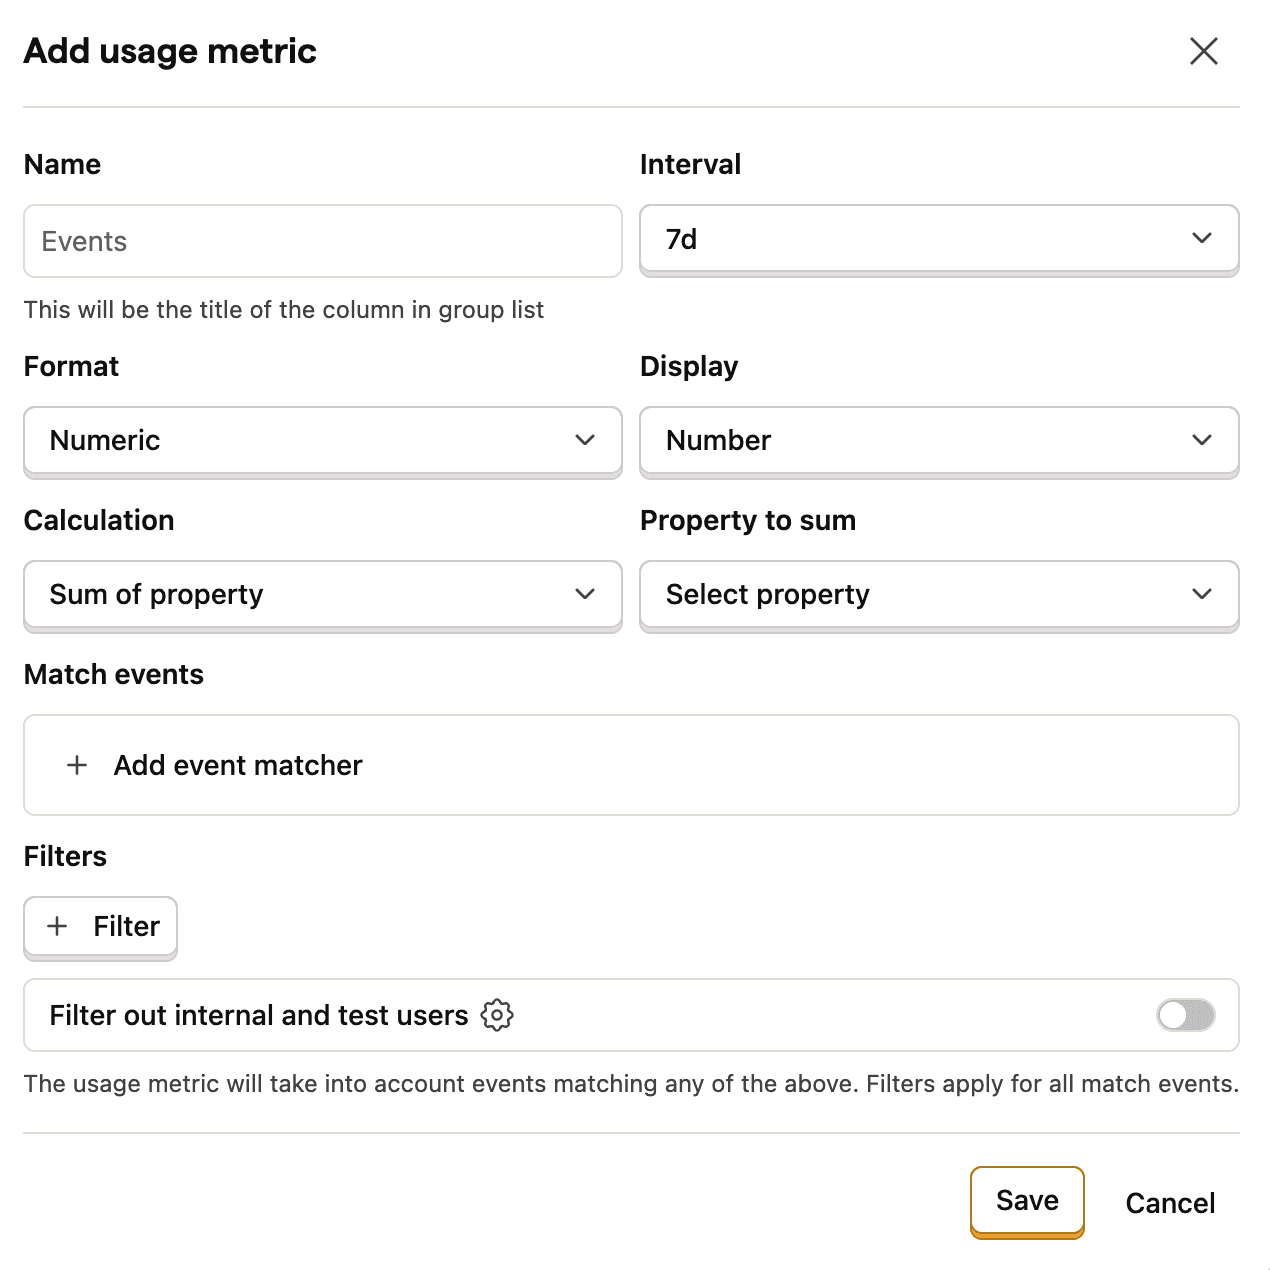
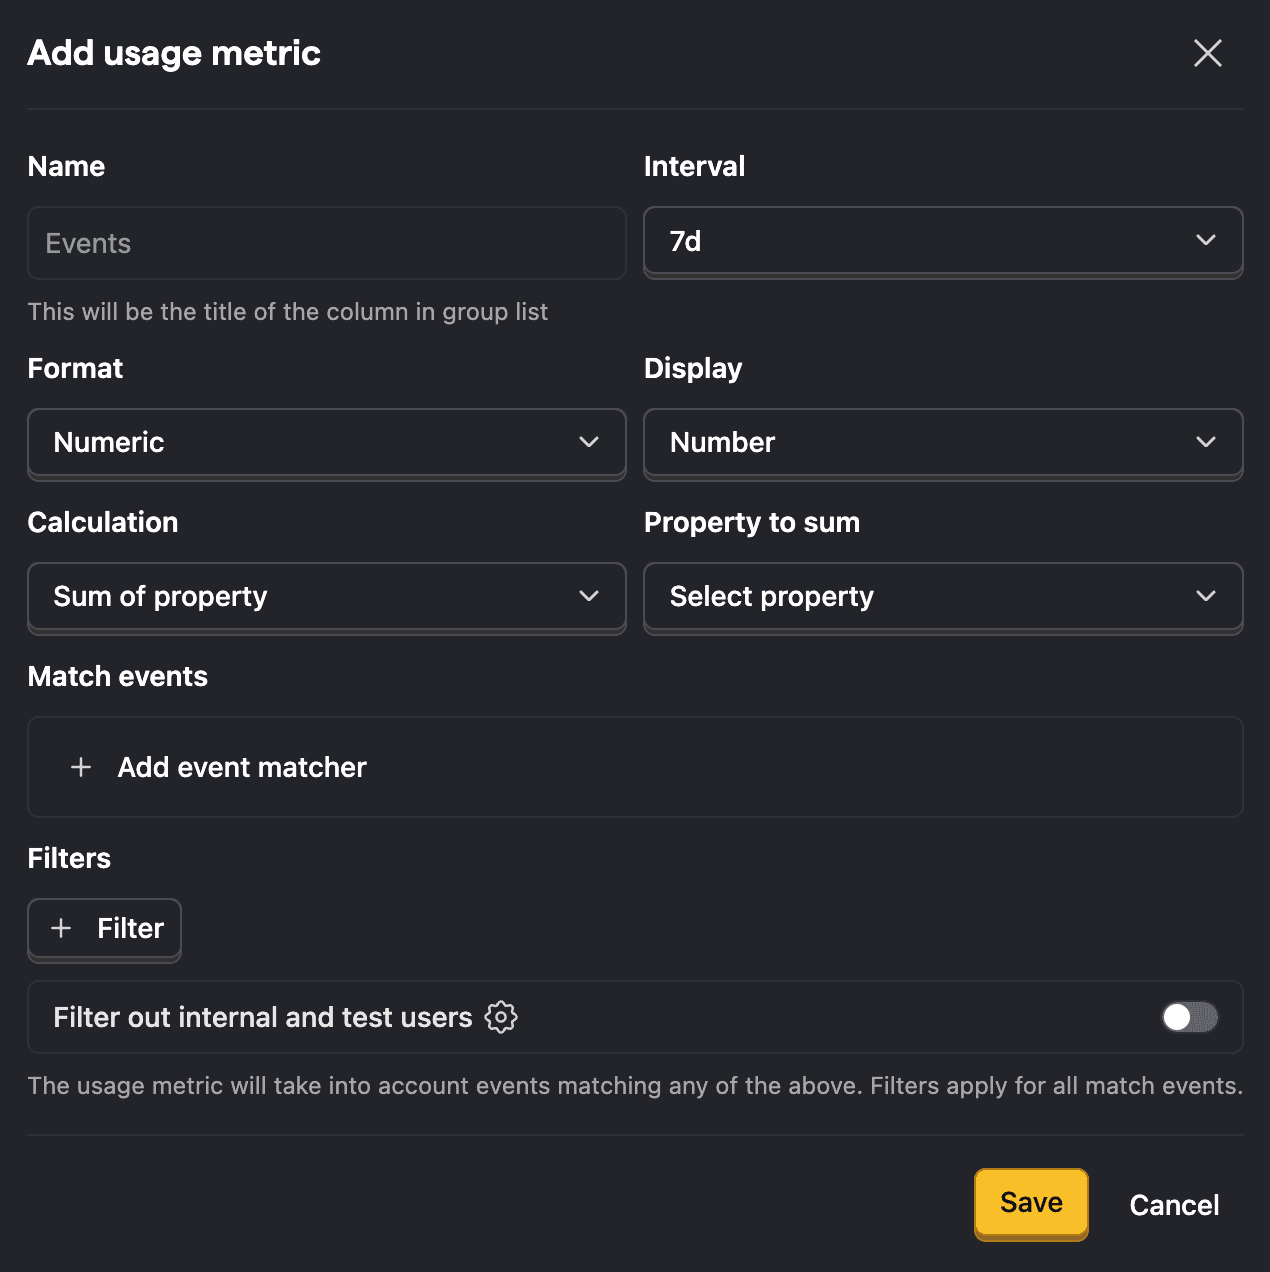
Configuration options
| Field | Description |
|---|---|
| Name | The column title shown in customer lists |
| Interval | Time period for the metric: 7, 30 or 90 days |
| Format | How the value should be formated: Numeric or currency |
| Display | How the metric is visualized: Number (default) or Sparkline |
| Calculation | How events are aggregated: Count of events (default) or Sum of property |
| Property to sum | The numeric property to sum. Only shown when Calculation is set to Sum of property |
| Match events | Which events to count toward this metric |
| Filters | Additional conditions to narrow down matched events |
Match events
Click Add event matcher to specify which events count toward this metric. You can add multiple event matchers, the metric will count events matching any of them.
For example, to track API usage, you might match events named api_request or api_call.
Filters
Filters apply to all matched events. Use them to narrow down what counts—for example, only counting successful API calls by filtering for status = 200.
Calculation
Choose how events are aggregated for the metric:
- Count of events – Counts the total number of matched events. This is the default.
- Sum of property – Sums the values of a numeric event property across matched events. When selected, a Property to sum field appears where you select the property to aggregate. This is useful for tracking cumulative values like API tokens consumed, storage used, or revenue generated.
Display
Choose how the metric is visualized on customer profiles:
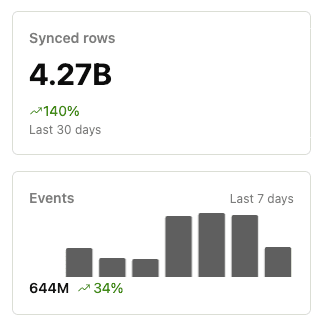
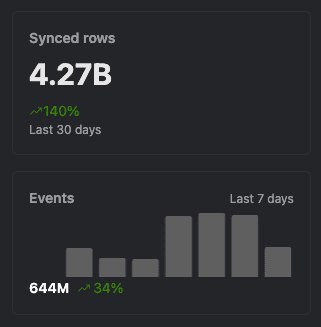
- Number – Shows a single numeric value with a percentage change indicator. This is the default.
- Sparkline – Shows a bar chart of daily values over the selected interval, along with the total value and percentage change. Useful for spotting trends at a glance.